Conduit Fill Visualizer
Calculating fill percentage is just math: (Total Wire Area / Total Conduit Area). The real safety value comes from visualization and jam detection.
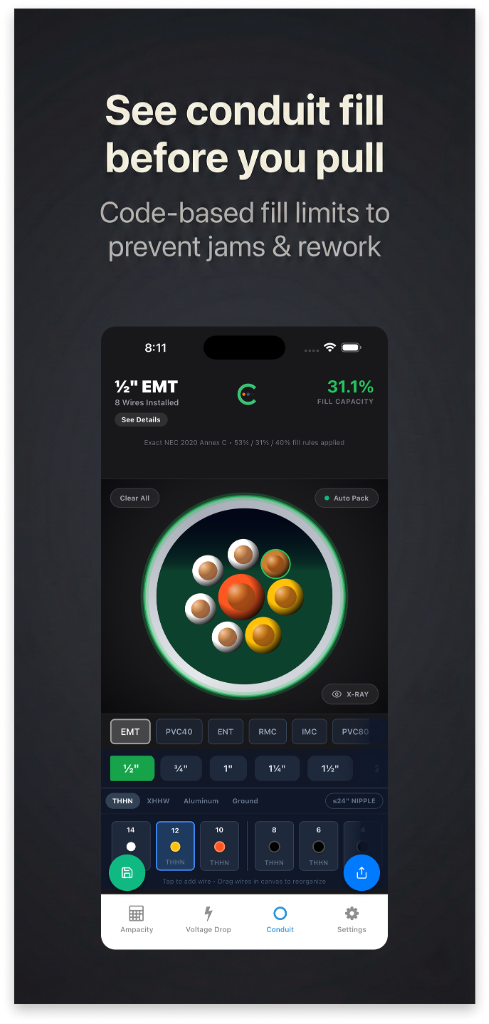
Drag-and-drop conductors into the conduit.
Auto-pack reflows the layout as you add or remove wires.
Real-time fill percentage and jam-ratio warnings.
X-ray cross-section view (Pro) to show the actual stack inside the raceway.
Official Dimensions
The NEC defines the official dimensions for both conductors (approximate area) and raceways (internal diameter).
ConduitLab uses these official geometric definitions to draw the conduit cross-section so you can see how the conductors sit in the raceway—not only the fill percentage on paper.
The Jam Ratio Danger Zone
When pulling three conductors into a conduit, there is a specific ratio of conduit ID to conductor OD (roughly 2.8 to 3.2) where the wires can wedge against each other in a triangle formation.
This is called a Jam. It can destroy the wire insulation during the pull. Our engine calculates this ratio and warns you if your selection falls into this danger zone.
See the jam before it happens